


A while back I ran a self-contained exercise: take a mid-sized, domestically-focused Czech Online Travel Agency (OTA) — call it “the Platform” — and assess where it should be putting its growth effort, using only what’s publicly available. No internal analytics, no booking data, no access to the business at all. Just search data, manually-collected listing counts, public reviews, and the live website.
It turned into a decent case study for a question that comes up a lot in early-stage marketing and growth work: how do you size opportunity when you don’t have the client’s internal numbers yet? Here’s the method, what it found, and what I’d actually prioritize off the back of it.
The setup
The Platform competes across four accommodation categories: City/Heritage, Spa/Wellness, Mountain/Active Nature, and Leisure/Countryside & Wine — a fairly standard segmentation for Czech domestic tourism. The question was simple to state and hard to answer cleanly: for each segment, how prepared is the Platform’s supply relative to actual market potential, and where’s the room to grow?
Method
I leaned on two independent, cross-checked data sources rather than either alone:
- Keyword search demand — Google and Sklik search volume and CPC for representative destinations in each segment (Prague, Brno, Český Krumlov for City; Karlovy Vary, Mariánské Lázně, Luhačovice for Spa; and so on).
- A tourism-scale proxy — since no segment-level revenue or booking data is public anywhere, I used official regional overnight-stay statistics (the Czech Statistical Office publishes these by region) as the best available proxy for commercial scale. It’s imperfect — regions don’t map perfectly onto marketing segments, and a region like South Moravia legitimately belongs to both a “city” story (Brno) and a “wine country” story — so I flagged that overlap explicitly rather than pretending the numbers were cleaner than they are.
Neither signal is trustworthy alone. Search volume is cheap to game and reflects intent more than actual scale. Tourism stats are the opposite problem — real scale, but slow-moving and not specific to a marketing segment. Blended together (normalized and averaged into a single Demand Index, City = 100), they cross-check each other reasonably well.
Alongside demand, I manually built a supply benchmark: listing counts for the Platform and four competitors — a global booking giant, a coupon/deals site, and two private-accommodation aggregators — across the same representative destinations. Purely a count of what’s listed per platform per destination; not weighted by quality, price, or actual bookings, which is a real limitation worth stating up front.
Finding 1: supply and demand don’t move together
| Segment | Search Volume | Tourism Proxy | Demand Index |
|---|---|---|---|
| City / Heritage | 40.1k | 11.7M nights | 100 |
| Spa / Wellness | 20.5k | 7.7M nights | 58 |
| Mountain / Active Nature | 7.5k | 10.3M nights | 53 |
| Leisure / Countryside & Wine | 6.2k | 8.7M nights | 45 |
Against this, the Platform’s own listing counts, relative to the four competitors, were strongest in City and Spa, moderate in Mountain, and thin in Leisure — where the private-accommodation aggregators had roughly 7x the Platform’s listing count despite Leisure being a real, sizeable demand segment on its own. That gap is the first useful signal. A specialist competitor has built real supply in Leisure that the Platform hasn’t matched — a more concrete, more actionable story than a generic “the Platform is behind.”
Finding 2: the opportunity/market-share inversion
This is the part I’d actually generalize into a broader lesson, because it’s not specific to this company.
I combined the Demand Index with a Competitive Index (the Platform’s share of listings among the local competitors only, excluding the global giant — since competing on raw inventory against a company with a 20x supply advantage isn’t a fair fight or a useful goal) into a single Opportunity Score. Separately, I calculated the Platform’s actual Market Share — its share of all five platforms combined, global giant included.
| Segment | Demand Index | Competitive Index | Market Share | Opportunity Score |
|---|---|---|---|---|
| City / Heritage | 100 | 44 | 5.6% | 56 |
| Mountain / Active Nature | 53 | 19 | 3.9% | 43 |
| Leisure / Countryside & Wine | 45 | 9 | 5.3% | 41 |
| Spa / Wellness | 58 | 38 | 13.0% | 36 |
Notice the inversion: Spa is where the Platform has its strongest actual market position (13% share) — and the lowest opportunity score, because that share is already fairly well captured. City is the opposite: the lowest actual market share (5.6%, because the global giant so thoroughly dominates it) but the highest opportunity score, because demand is enormous and the Platform’s position among local competitors specifically is strong.
Read either metric alone and you get a different, wrong-ish answer. Opportunity Score alone says “go all-in on City.” Market Share alone says “City’s a lost cause, protect Spa.” Neither is right in isolation — a low share in a segment dominated by a global player could mean real headroom against local competitors, or it could mean the segment is structurally hard for a challenger brand to win regardless of local competitive dynamics. You need both numbers on the table before you commit resourcing, and I don’t think that’s specific to OTAs — it’s a pattern worth checking anywhere “opportunity” and “current position” get conflated into one growth story.
Positioning: what reviews actually say
I read through a sample of public reviews (~140 entries from one review platform, skewing toward general satisfaction; a much smaller, more recent sample on a second platform skewing negative — more on that split below) and pulled out recurring language, mapped to a possible USP direction:
| Theme | What reviewers actually say | USP direction |
|---|---|---|
| Speed | “fast,” “processed immediately” | Book quickly, without hassle |
| Simplicity | “simple,” “everything went smoothly” | Easy booking for everyone |
| Human assistance | “help on the phone,” “staff helped” | Real people are there when you need them |
| Domestic expertise | wide coverage of local destinations | The local accommodation specialist |
The strongest, most defensible angle by a clear margin was the combination of domestic expertise and human assistance — a local, human-guided alternative to a faceless global search engine, rather than trying to out-feature or out-scale the giant on its own terms. To carry that visually, I sketched a mascot/guide concept: a friendly local character positioned as a personal travel guide rather than a search interface.

One honest limit here: that theme table only draws on positive-sentiment reviews. A second, smaller and more recent cluster of reviews on a different platform tells a different story — reservations that went missing, support that was slow to respond when something broke. I don’t read that as contradicting the positive theme set. It’s a separate problem, happening at a separate moment in the relationship — after the booking, not during it — and it needs its own fix (see Priorities, below). The “human assistance” positioning still holds for the booking transaction itself; it just doesn’t cover what happens once something goes wrong afterward.
CX: where the booking flow actually loses people
One framing choice worth flagging: nothing here named a specific optimization target, so I treated conversion rate as the implicit goal and read the whole flow through that lens.
Walking the live booking flow against the global competitor as a reference point, a few consistent, fixable patterns showed up:
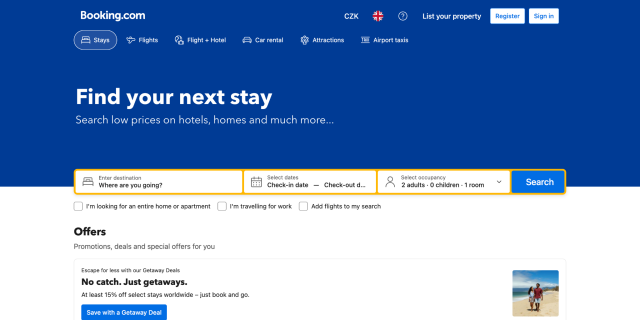
- Homepage: low-contrast hero imagery, low-contrast search placeholders, and a headline/subheading not anchored in any stated USP. Compare to a category leader’s homepage, which leads hard with a clear value prop and high-contrast, simple prompts:
- Search results: a large block of white space above the fold pushed actual listings down, forcing a scroll before anything actionable appeared.
- Listing pages: the Platform prompted booking action early (genuinely good — most competitors bury the CTA), but no secondary information — facilities, house rules, reviews — was visible without scrolling. A category leader surfaces that as a tab menu in the same space:

- Room selection: it was frequently unclear which room/rate was currently selected — the selected-room label was visually subtle and pushed off to the side by a room photo, working against a natural top-to-bottom, left-to-right scan pattern.
- Checkout: clean layout, clear summary, a visible trust signal — solid work, and worth calling out precisely because it’s tempting to assume checkout is where a booking flow leaks. Here, it isn’t.
Localization — translation, currency, local address formats — turned out to be a lower-priority lever than expected. The flow was already functionally localized. The real bottlenecks were usability and clarity, and no amount of translation work fixes either of those. And on customer service: rather than recommend blanket chat widgets everywhere (a common reflex, and one that risks diluting conversion and overloading support for a problem that isn’t the main bottleneck), a more targeted pattern made more sense — a passive, always-available chat for general visitors, and an active “assistant” prompt reserved for users showing real hesitation signals (repeated scrolling, rage clicks).
Priorities
If I were advising this business on where to spend the next quarter of effort, in order:
- Grow share in the highest-opportunity segment, deliberately. That’s a different call than defending the segment where the brand is already strongest — the two aren’t the same segment here, and that’s easy to miss without laying both metrics side by side.
- Lean into a “local expert” brand position, carried consistently — homepage, messaging, and support — by a distinctive, human visual identity rather than generic travel-site iconography.
- Fix homepage clarity before anything more ambitious. It’s the highest-leverage, lowest-cost item on this list: mostly a contrast and messaging fix, small enough to ship in a sprint.
- Remove the specific booking-flow friction points identified above. The whitespace issue and the room-selection ambiguity are both narrow, fixable UI problems — the kind of thing one focused design sprint resolves.
- Stand up a proper online reputation management function to address the reputational split between review platforms before it compounds — independent of the underlying support-process fix, since the split itself is a trust signal to new visitors regardless of whether the process gets better.
Working on something similar?
If you’re building or advising a hospitality or OTA business and want a second pair of eyes on growth strategy, market positioning, or conversion — this is the kind of work I do. Get in touch if you’d like to talk.

Martin Kura
Martin Kura works with B2B SaaS teams to clarify growth priorities using search and market data. His background spans 16+ years in international SEO, multilingual content, and cross-cultural marketing.